티스토리 뷰
김승욱님 강의를 듣고 작성하였습니다.
[R을 R려줘] R 시각화 기초 - 인프런
R 문법 기초에 이어서 진행되는 시각화 강좌 입니다. R의 강력한 시각화 패키지인 ggplot2를 집중적으로 배웁니다. 입문 데이터 분석 프로그래밍 언어 R 온라인 강의
www.inflearn.com
글자 모양 설정
기본 그래프
| ggplot(data = bar_df, aes(x=obs, y=value, color=value)) + geom_point(size=10) |
 |
그래프 1
| ggplot(data = bar_df, aes(x=obs, y=value, color=value)) + geom_point(size=10) + theme(axis.title=element_text(size=30)) |
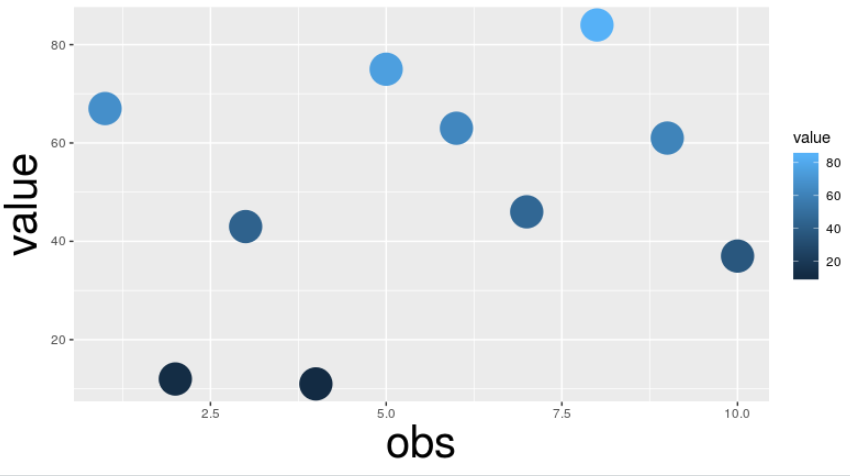 |
축 제목의 텍스트 요소 부분을 사이즈 30으로 만들겠다.
그래프 2
| ggplot(data = bar_df, aes(x=obs, y=value, color=value)) + geom_point(size=10) + theme(axis.title=element_text(size=30, face='bold')) |
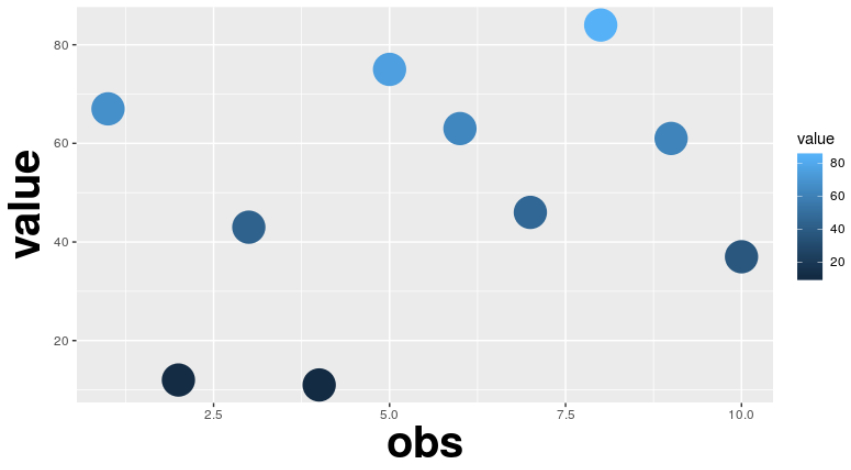 |
글씨 두껍게
그래프 3
| ggplot(data = bar_df, aes(x=obs, y=value, color=value)) + geom_point(size=10) + theme(axis.title=element_text(size=30, face='bold', angle=45)) |
 |
글씨 기울기 45도
그래프 4
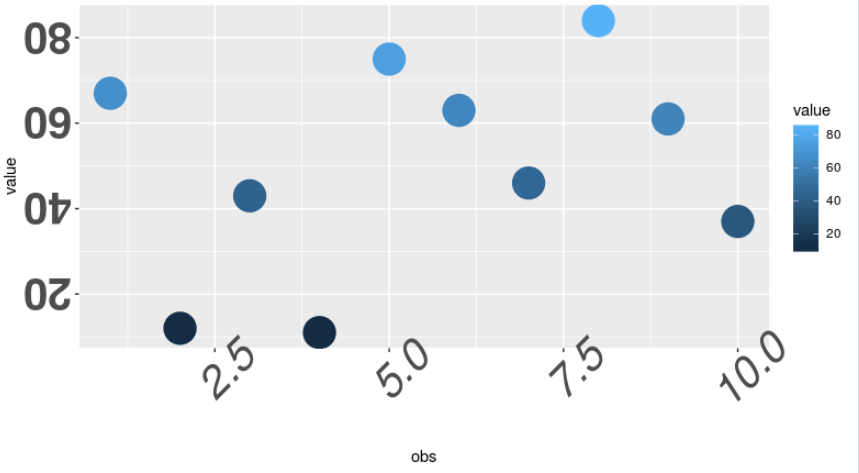
| ggplot(data = bar_df, aes(x=obs, y=value, color=value)) + geom_point(size=10) + theme(axis.text.x = element_text(size=30, face='italic', angle=45), axis.text.y = element_text(size =30, face = 'bold', angle = 180)) |
 |
제목 변경
그래프 1
| ggplot(data = bar_df, aes(x=obs, y=value, color=value)) + geom_point(size=10) + labs(x = 'title_x_axis', y = 'title_y_axis', title = 'This is title')+ theme(axis.title = element_text(size=30), title = element_text(size=40)) |
 |
title을 바꾸면 범례 제목의 크기도 바뀐다
그래프 2
| ggplot(data = bar_df, aes(x=obs, y=value, color=value)) + geom_point(size=10) + scale_x_continuous(name = 'X_axis_title')+ scale_y_continuous(name = 'Y_axis_title')+ ggtitle('Your Title')+ theme(axis.title = element_text(size=30), title = element_text(size=40)) |
 |
그래프 3
| ggplot(data = bar_df, aes(x=obs, y=value, color=value)) + geom_point(size=10) + theme(axis.title.y = element_text(size=30, face = 'bold', angle = 45)) |
 |
너무 올라가 있자너!?
| ggplot(data = bar_df, aes(x=obs, y=value, color=value)) + geom_point(size=10) + theme(axis.title.y = element_text(size=30, face = 'bold', angle = 45, vjust = 0.5)) |
 |
vjust 값이 0이면 아래로 1이면 위로, hjust는 x축에 있는 글자 위치 조정.
axis.text.x또는y = element_text(vjust 또는 hjust)를 하면 축에 있는 숫자위치를 미세조정 가능
그래프 4
| ggplot(data = bar_df, aes(x=obs, y=value, color=value)) + geom_point(size=10) + theme(axis.title.x = element_text(size=30, face = 'bold', angle = 45)) |
 |
보너스
| ggplot(data = bar_df, aes(x=obs, y=value, color=value)) + geom_point(size=10) + labs(title = 'The Title', subtitle = 'The sub title', x = 'x', y = 'y', color = 'colors')+ theme(title = element_text(size = 30)) |
 |
title, subtitle, x축, y축, 범례 글자 바꾸는 방법.
범례 같은 경우는 기본 글자가 shape로 되어있으면 shape = '****' 와 같이 써야 한다.
| ggplot(data = bar_df, aes(x=obs, y=value, color=value)) + geom_point(size=10) + labs(title = 'The Title', subtitle = 'The sub title', x = 'x', y = 'y', color = 'colors')+ theme(title = element_text(size = 30), axis.title.x = element_blank()) |
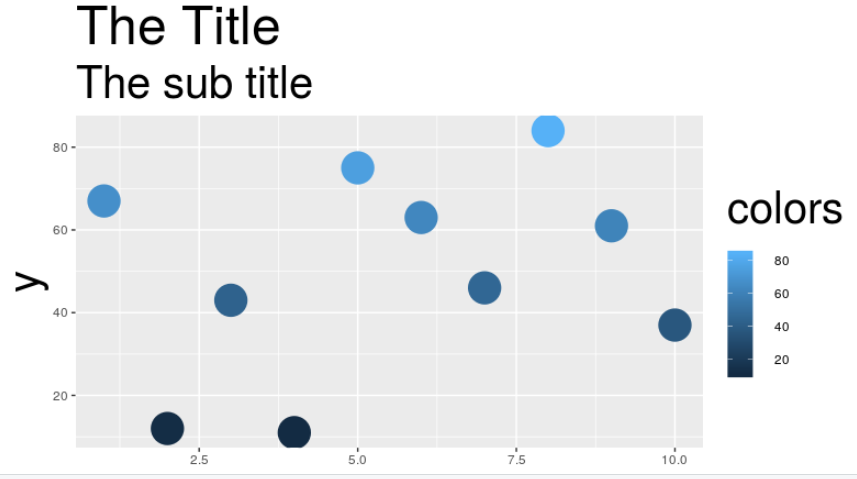 |
x축 글자 없애기
y, subtitle도 없앨 수 있다.
'beginner > R 시각화 기초' 카테고리의 다른 글
| ggplot 범례 (0) | 2019.08.13 |
|---|---|
| ggplot 덧그리기 (0) | 2019.08.12 |
| ggplot 요소설정 (0) | 2019.08.07 |
| ggplot 축 설정 (0) | 2019.08.07 |
| ggplot 색상 설정-3 (0) | 2019.08.06 |
