티스토리 뷰
김승욱님의 강의를 듣고 작성하였습니다.
[R을 R려줘] R 시각화 기초 - 인프런
R 문법 기초에 이어서 진행되는 시각화 강좌 입니다. R의 강력한 시각화 패키지인 ggplot2를 집중적으로 배웁니다. 입문 데이터 분석 프로그래밍 언어 R 온라인 강의
www.inflearn.com
막대 그래프
데이터 준비
| > color_df = data.frame( obs = 1:10, + var = rep(c('A', 'B', 'C'), length.out=10), + value = sample(1:100, size=10), + stringsAsFactors = F) > head(color_df) obs var value 1 1 A 13 2 2 B 60 3 3 C 100 4 4 A 50 5 5 B 78 6 6 C 97 |
그래프 1
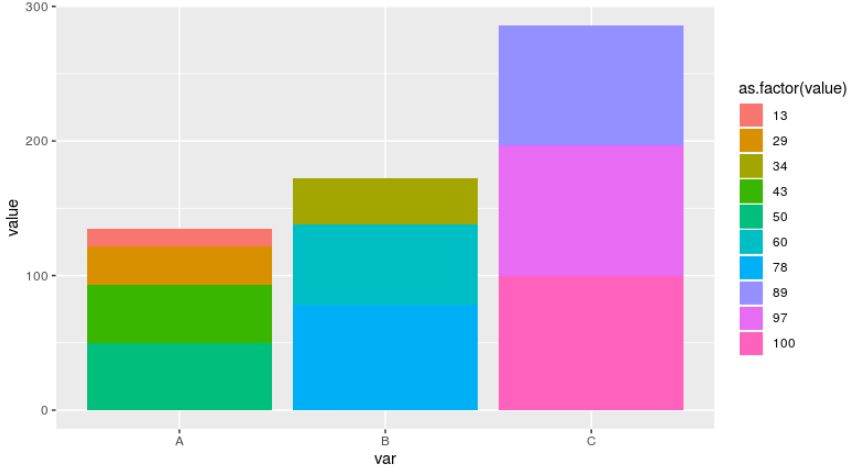
| > ggplot(data = color_df, aes(x = var, + y = value, + fill = as.factor(value)))+ + geom_bar(stat = 'identity', position = 'stack') |
 |
그래프 2
| > ggplot(data = color_df, aes(x = var, + y = value, + fill = 'blue'))+ + geom_bar(stat = 'identity', position = 'stack') |
 |
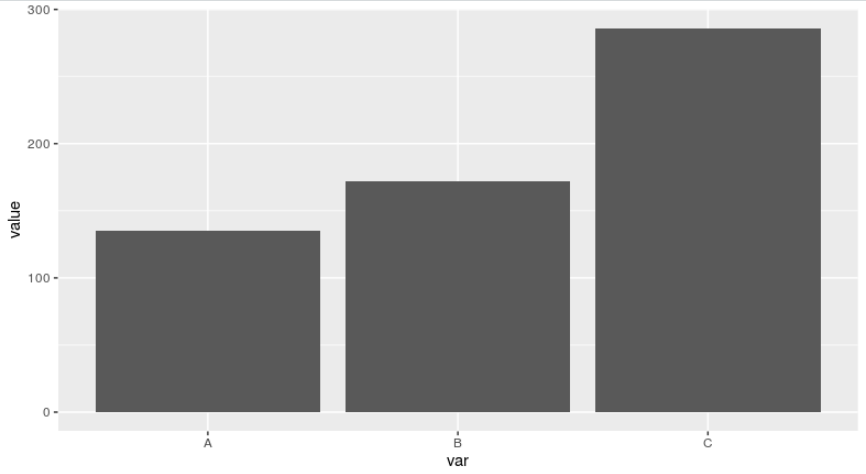
내가 원하는 색깔로 일괄로 입히겠다. 'blue'라고 했는데 다른식이 나왔네..?
그래프 3
| > ggplot(data = color_df, aes(x = var, + y = value), + fill = 'blue')+ + geom_bar(stat = 'identity', position = 'stack') |
 |
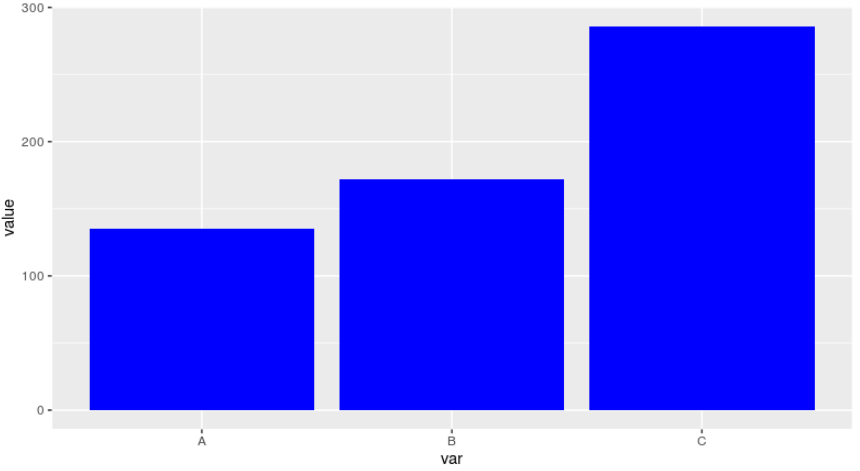
fill을 괄호 밖에서 해봤지만 이번에는 색상이 아에 나타나지 않았다.
그래프 4
| > ggplot(data = color_df, aes(x = var, + y = value))+ + geom_bar(stat = 'identity', + position = 'stack', + fill = 'blue') |
 |
그래프 5
| > ggplot(data = color_df, aes(x = var, + y = value))+ + geom_bar(stat = 'identity', + position = 'stack', + fill = 'blue', + alpha = 0.3) |
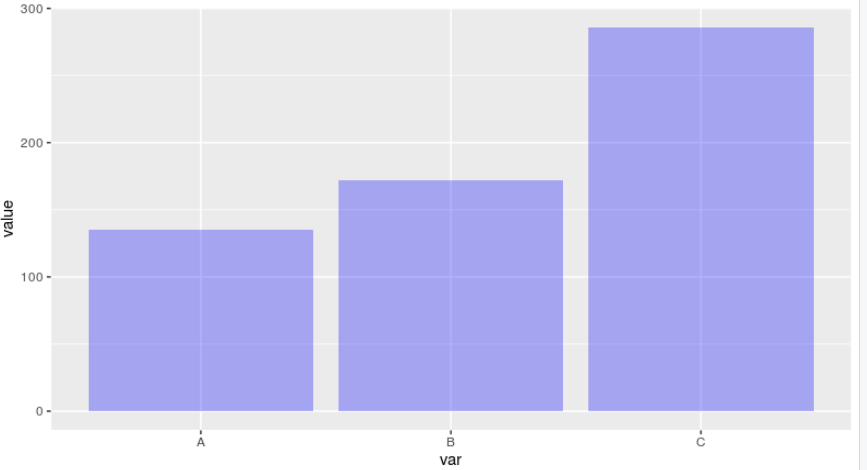 |
여러개의 그래프가 겹쳐있을때, 특히 산점도에서 alpha(투명도)를 이용한다.
'beginner > R 시각화 기초' 카테고리의 다른 글
| ggplot 축 설정 (0) | 2019.08.07 |
|---|---|
| ggplot 색상 설정-3 (0) | 2019.08.06 |
| ggplot 색상 설정-1 (0) | 2019.07.31 |
| ggplot 다중 그래프 (0) | 2019.07.30 |
| ggplot 기본문법 (0) | 2019.07.30 |
