
 Tensorflow로 Fancy Softmax Clasification 구현
Tensorflow로 Fancy Softmax Clasification 구현 1. Softmax_cross_entropy_with_logits 이 함수를 사용하면 굉장히 깔끔하게 만들수 있는데 마지막에 항상 logit을 넘겨준다는 겻을 기억할 것. logits = tf.matmul(X, W) + b hypothesis = tf.nn.softmax(logits) In [ ]: # Cross entropy cost/loss cost = tf.reduce_mean(-tf.reduce_sum(Y * tf.log(hypothesis), axis=1)) # Y 는 one hot으로 주어짐 In [ ]: # Cross entropy cost/loss cost_i = tf.nn.softmax_cross_entropy_..
 Tensorflow로 Softmax Classification의 구현하기
Tensorflow로 Softmax Classification의 구현하기 soft max function은 여러개 클래스 예측할 때 좋아 In [1]: import tensorflow as tf 1. 텐서플로우로 어떻게 구현할 것인가? hypothesis = tf.nn.softmax(tf.matmul(X,W)+b) tf.matmul(X,W)+b 는 XW=y를 의미한다. scores 부분을 logit이라고 부르기도 한다. Cost function: cross entropy 소프트 맥스에 걸맞는 loss function이 필요하다. loss function은 텐서플로우로 굉장히 쉽게 구현 가능하다. Cost = tf. reduce_mean(-tf.reduce_sum(Y * tf.log(hypothesis),..
 Softmax Regression 이론
Multinomial Classification Linear Regression을 이용해 예측을 하였고, 이는 100, 200, -10 등의 어떤 하나의 실수 값을 예측 하는데는 유용한 모델이지만 Binary한 모델에는 적합하지 않다는 것을 보았다. 그래서 예측값들을 Logistic Regression을 이용하여 0과 1사이의 수로 압축을 한 다음, 0과 1이라는 Binary한 값으로 예측을 하였다. 이제는 Binary한 구분을 넘어 Multinomial한 구분을 하는 예측을 해보자. 입력 값 X를 넣고, W라는 unit을 가지고 계산을 해서 Z값이 나오고, 이를 Sigmoid 함수에 넣으면 0과 1사이의 값을 가지는 Y bar가 나온다. Logistic Regression을 학습시킨 다는 것은 2개의 ..
 Logistic Classification 이론
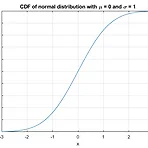
Classification Binary한 값을 예측하기 위한 모델: 이메일-스팸메일 구분, 페이스북 타임라인에서 특정 피드 보여주기-숨기기, 신용카드 도난 여부 확인, 주식 시장 예측 Binary한 값의 예측을 Linear Regression을 사용하여 하면 어떻게 될까? 예측값보다 큰 값으로 학습을 진행하면 그래프가 기울어지며 예측을 정확하게 하지 못한다. 따라서 Linear Regression 대신 0과 1 사이의 값으로 압축시켜주는 Sigmoid 함수를 도입한다. g(z) : 시그모이드 함수에 Hypothesis 함수를 합성하여 시그모이드 함수의 Hypothesis함수를 만들면 다음과 같이 나타난다. Linear Regression의 가설과 비용함수를 다시 상기해보자. 가설 : H(x) = Wx+b..
 Logistic Regression
Logistic Regression¶ In [1]: from PIL import Image Image.open('Logistic Regression.png') Out[1]: Training Data¶ In [5]: import tensorflow as tf x_data = [[1, 2], [2, 3], [3, 1], [4, 3], [5, 3], [6, 2]] y_data = [[0], [0], [0], [1], [1], [1]] # placeholders for a tensor that will be always fed. X = tf.placeholder(tf.float32, shape=[None, 2]) Y = tf.placeholder(tf.float32, shape=[None, 1]) W = tf...
 Loading data from file
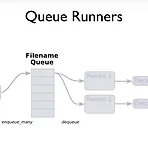
Loading data from file¶ 넘파이를 이용하여 구해보자. In [1]: import numpy as np In [2]: from PIL import Image Image.open('data-01-test-score.png') Out[2]: In [3]: xy = np.loadtxt('data-01-test-score.csv', delimiter=',', dtype=np.float32) # 모두 같은 타입이어야만 가능 x_data = xy[:, 0:-1] y_data = xy[:, [-1]] In [ ]: ##### 슬라이싱 ##### nums = range(5) # range is a built-in function that creates a list of integers print num..
 Multi-variable linear regression
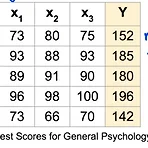
Multi-variable linear regression¶ In [5]: from PIL import Image Image.open('그림3.png') Out[5]: H(x1,x2,x3) = x1w1 + x2w2 + x3w3¶ In [ ]: import tensorflow as tf x1_data = [73., 93., 89., 96., 73.] x2_data = [80., 88., 91., 98., 66.] x3_data = [75., 93., 90., 100., 70.] y_data = [152., 185., 180., 196., 142.] # placeholders for a tensor that will be always fed. x1 = tf.placeholder(tf.float32) x2 =..
 Linear Regression의 cost 최소화의 TensorFlow 구현
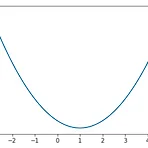
Linear Regression의 cost 최소화의 TensorFlow 구현¶ cost함수는 어떻게 생겼을까?¶ In [6]: import tensorflow as tf import matplotlib.pyplot as plt X = [1,2,3] Y = [1,2,3] W =tf.placeholder(tf.float32) # Out hypothesis for linear molde X * W hypothesis = X * W # cost/loss function cost = tf.reduce_mean(tf.square(hypothesis - Y)) #Launch the graph in a session. sess = tf.Session() # Initializes global variables in th..